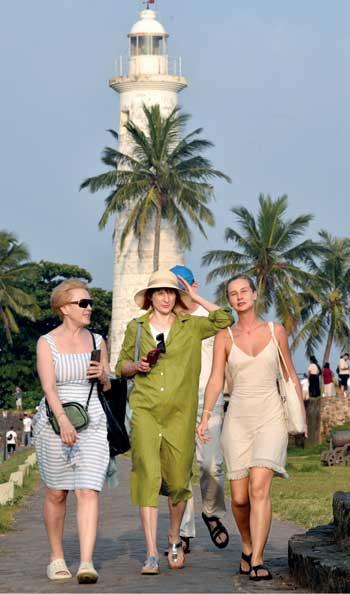
Galle Fort has emerged as Sri Lanka’s most visited tourist attraction, overtaking several long-standing cultural and urban landmarks and appearing in the itineraries of more than 54 percent of foreign travellers, according to the latest survey by the Sri Lanka Tourism Development Authority (SLTDA).
The survey, which covered 11,731 departing tourists over the 12-month period ending June 2025, points to a significant shift in Sri Lanka’s traditional tourism landscape, with travellers increasingly favouring destinations built around experiences, natural beauty and distinctive cultural environments.
Galle Fort was visited by 6,340 respondents, representing 54.0 percent of those surveyed. It was closely followed by Ella and Sigiriya Rock Fortress, which were tied at 53.1 percent. The result places the southern colonial fortress ahead of Colombo and Kandy’s Temple of the Tooth, which have historically served as major anchors of Sri Lanka’s inbound tourism routes.
The shift is particularly evident when compared with the previous 2018/2019 survey. At the time, Colombo ranked first with 68.3 percent, followed by the Temple of the Tooth at 64.9 percent. In the latest survey, Colombo dropped to fifth place with 46.2 percent, while the Temple of the Tooth ranked fourth at 51.3 percent.
Galle Fort, meanwhile, increased its share from 48.9 percent, reflecting changing preferences among international travellers who are increasingly drawn to visually distinctive destinations and walkable historic environments rather than primarily urban centres.
The SLTDA analysis attributed the growing popularity of Galle Fort, alongside destinations such as Ella and Sigiriya, to a broader shift towards experiential and highly shareable travel. Younger and independent travellers in particular are increasingly seeking accessible, photogenic locations with strong social media appeal.
Galle Fort’s ocean-facing ramparts, preserved colonial architecture, historic streets and boutique cafés provide the type of setting that aligns with this evolving travel preference. This has helped the fortress gain ground over established Cultural Triangle destinations such as Anuradhapura and Polonnaruwa, whose visitor shares fell to 14.2 percent and 13.8 percent, respectively.
Galle Fort also recorded the highest number of repeat visitors among the surveyed destinations, with 772 returning visitors. This was ahead of Kandy at 604 and Sigiriya at 539. First-time visitors nevertheless continued to account for the majority of Galle Fort’s visitors, at 5,567, indicating the destination’s ability to attract both new and returning travellers to the Southern province.
However, its top ranking does not necessarily translate into longer stays. The average duration of stay at Galle Fort was 1.63 days, suggesting that many visitors continue to experience the historic site as a short excursion or brief stopover rather than using it as a longer base for exploring the region.
The SLTDA report highlighted the opportunity to convert Galle Fort’s strong visitor traffic into greater economic value by connecting the destination more closely with surrounding attractions and tourism hubs in the South.
Neighbouring coastal destinations already record considerably longer average stays. Weligama leads with 3.15 days, followed by Hikkaduwa at 2.35 days and Mirissa at 2.14 days. Linking Galle Fort with the region’s marine, culinary and leisure experiences through integrated multi-day itineraries could potentially encourage visitors to extend their stays, while spreading tourism spending across a wider network of businesses.
The broader southern tourism belt has also strengthened around Galle. Mirissa increased its visitor share to 34.4 percent from 32.6 percent, while Unawatuna rose to 17.1 percent from 14.8 percent and Bentota increased to 16.2 percent from 13.1 percent. This places four of Sri Lanka’s 10 most visited destinations within approximately 60 kilometres of Galle.
The growth, however, has not been consistent across all southern destinations. Hikkaduwa’s share declined to 18.9 percent from 21.0 percent, while Weligama fell to 15.7 percent from 17.6 percent. The movement suggests that visitor traffic may be shifting between established resort towns along the same coastline rather than representing an equal expansion of tourism demand across the entire southern belt.
Length-of-stay figures further highlight the value of connecting these destinations. The five principal southern beach towns recorded an average stay of 2.43 days, compared with 1.72 days across the five most visited cultural and urban sites, representing a 41 percent advantage in visitor nights.
Negombo remains an exception to this pattern. Its visitor share eased to 25.8 percent from 27.1 percent, while its average stay of 1.60 days was the shortest among the coastal destinations surveyed. This is consistent with the town’s role for many travellers as an airport-linked transit destination rather than a longer holiday base.
Wildlife tourism has emerged as another major driver of the changing tourism landscape. Yala National Park almost doubled its visitor penetration, rising to 32.8 percent from 17.5 percent, representing the sharpest proportional increase recorded in the survey. The national park consequently entered the top 10 alongside Dambulla and Mirissa.
The gains at Yala came as several other wildlife destinations recorded declines. Udawalawe fell to 17.6 percent from 22.2 percent, while Minneriya dropped to 3.4 percent from 6.5 percent and Kaudulla declined to 3.5 percent from 4.6 percent. The figures suggest that growing safari demand is becoming increasingly concentrated around Yala rather than reflecting broad-based growth across Sri Lanka’s wildlife destinations.
Wilpattu was an exception, with its share almost tripling to 5.9 percent from 2.0 percent. Despite Yala’s popularity, the average stay there remained relatively short at 1.31 days, while the SLTDA report identified overcrowding at the park among the sustainability concerns associated with growing tourism demand.
The activities preferred by international visitors further illustrate the changing nature of Sri Lanka’s tourism market. Beach and sea activities ranked first, attracting 67 percent of tourists, followed by wildlife safaris at 47 percent and sightseeing excursions at 32 percent.
Hiking and trekking attracted 22 percent of visitors, while culinary tourism accounted for 21 percent and surfing 20 percent. Notably, surfing ranked ahead of visits to religious sites, which attracted 15 percent of tourists. Snorkelling accounted for 7 percent, watersports 4 percent, whale and dolphin watching 3 percent, and scuba diving and shipwreck diving 2 percent.
Despite their ability to retain visitors for longer periods, destinations in Sri Lanka’s Eastern and Northern regions remain outside the country’s most heavily travelled circuit.
Arugam Bay recorded the longest average stay in the country at 3.88 days, despite its visitor share declining to 7.7 percent from 11.4 percent. Jaffna recorded an average stay of 3.61 days with a visitor share of just 3.6 percent, while Passikudah recorded 2.83 days on a 2.8 percent share and Trincomalee 2.62 days on a 9.7 percent share.
Together, these four destinations recorded an average stay of 3.24 days, almost double the 1.72-day average recorded across the five most visited cultural and urban sites.
The figures point to a significant opportunity for Sri Lanka’s tourism industry. While Galle Fort, Ella and Sigiriya are attracting the greatest volumes of international visitors, several destinations in the East and North demonstrate a stronger ability to retain them.
For Sri Lanka, the next phase of tourism growth could therefore depend not only on attracting more visitors, but on creating stronger connections between high-demand attractions and destinations capable of extending visitor stays. Integrating heritage, beaches, wildlife, food, adventure and regional experiences into longer travel circuits could help distribute tourism benefits more widely while increasing the overall value generated by each visitor.
Image Disclaimer: Images used in this article are the property of their respective copyright holders and rightful owners. No ownership is claimed over the images.